 In a report published by Adobe based on the US Digital Video Benchmark Report that looked at over 19.6 billion Video starts on the media websites, here are a few findings that will help advertisers plan their video advertising. The Benchmark is based on 10.1 billion ads served, 457 Million facebook posts and 365 Million Facebook Comments. Adobe customers produced 15.6 billion video streams in Q4 1012 – Eleven times the Movie Ticket sales in the US in 2012.
Key Findings From The Digital Video Benchmark Report
Digital video Consumption has grown by over 30 % every year and New TV and sports content drove the highest growth in video streams since 2012.

Growing mobile audience provides greater engagement opportunities and avenues for advertising for publishers as video has greater cpm.
Smartphones viewing is during the week more outside the home for news, weather and sports clips, while tablets are used for livestreaming during the weekend for live sports, movies and television.
Video Completion rates for PC are linked to banner advertising which is good for branding, however tablet advertising is good for call to action advertising.
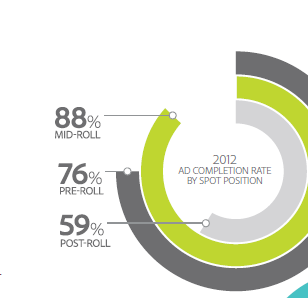
Video Ad completion rates are highest through mid-roll though they have the second highest reach. Advertisers seeking greater response should focus on post-roll advertising. For impressions go with pre-roll.
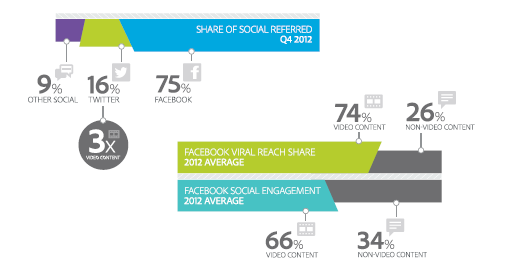
Video has greater Viral reach at 77 % in Q4 compared to 55 % in Q1, though Twitter has three times more referral for video content, Facebook referrals are more likely to be completed.
Some important terms to guide your Media Buying

Source: CIO Whitepapers, Adobe The US Digital Video Benchmark Q1 2013
