“Mobile’s continued rise speaks to consumers’ increasing reliance on smartphones and tablets, whether on-the-go or at home. And, digital video too is seeing gains that reflect a new ‘viewing’ paradigm that is taking place on interactive screens, big or small.”
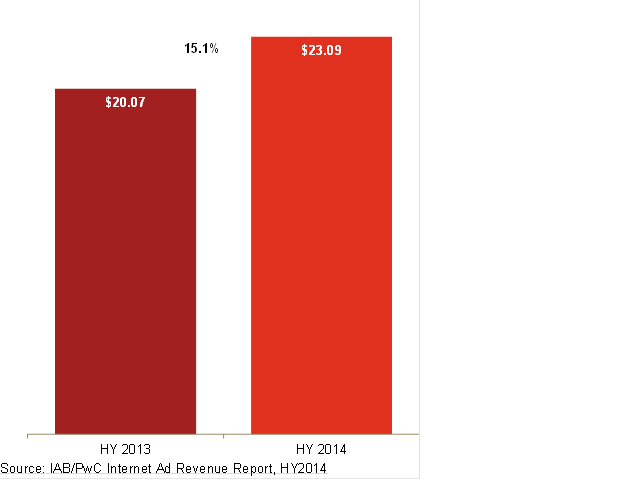
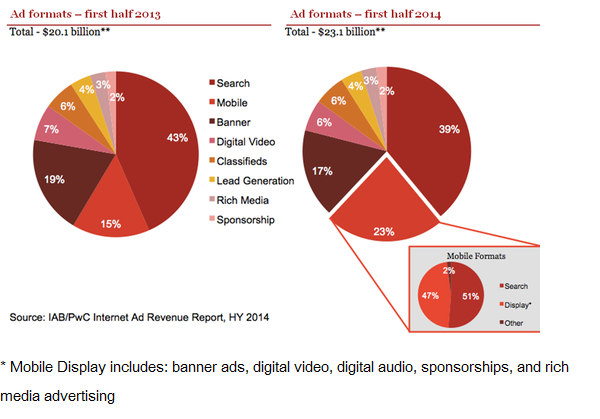 Internet advertising revenues in the United States were at USD 11.7 billion in the second quarter of 2014 Year-to-date revenues through June 2014 at USD 23.1 billion, up 15.1 percent from the USD 20.1 billion reported in 2013, according to a report published by PwC, sponsored by IAB.
“This report confirms the fact that brands are deepening their commitment to interactive advertising, and that mobile is seen as a crucial part of the marketing mix. Moreover, with second half revenues traditionally surpassing those in the first half of the year, this milestone achievement is potentially a harbinger of even stronger digital ad revenues to come.” — Randall Rothenberg, President and CEO, IAB
Mobile advertising increases 76 percent in HY 2014 — Mobile advertising in the United States has been estimated at USD 5.3 billion during HY 2014, up from USD 3.0 billion in the first six months of 2013.
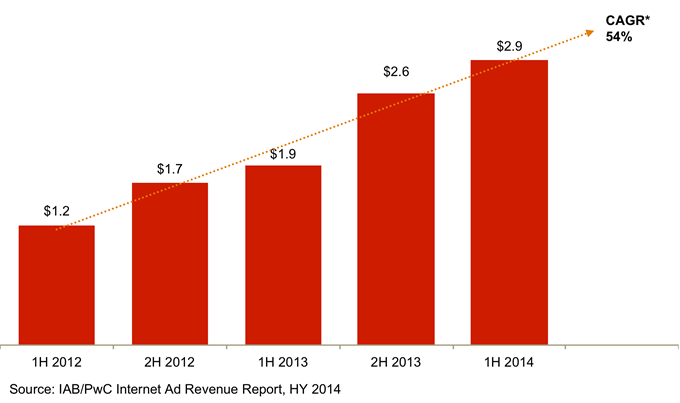
The key driver of growth continues to be Retail industry where the share of advertising revenue remained consistent with the last year. The performance based measurement model is the preferred metric and Social Media advertising has displayed a CAGR of 54 percent with YTD revenues of USD 2.9 Bn.
Social Media Advertising revenues grew by USD 1 Billion accounting for 33 percent of Advertising Revenue Growth.
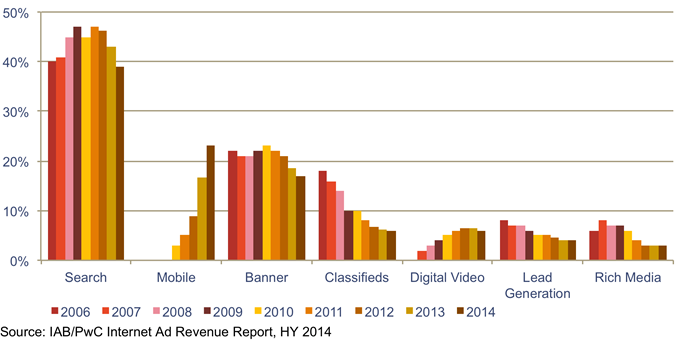
- Search has declined in share of revenues accounting for USD 4.5 billion -38 percent of total of Q2 2014 revenues, compared with USD 4.4 billion – 43 percent of total in Q2 2013. Inclusive of mobile-related search revenue, the Search format totaled USD 5.9 billion -51 percent of total in Q2 2014 revenue.
- Display-related advertising accounted for USD 3.3 billion or 28 percent of total revenues during Q2 2014, up 5 percent from the USD 3.1 billion- 30 percent of total reported in Q2 2013. Q2 2014 Display-related advertising includes Banner Ads 17 percent of revenues, or USD 2.0 billion, Digital Video 7 percent or $760 million, Rich Media 3 percentor $355 million, and Sponsorship 2 percent or USD187 million. Inclusive of mobile-related display revenue, the Display-related format totaled USD 4.6 billion 39 percent of total in Q2 2014 revenue.
- Mobile revenues increased 71% from the USD 1.6 billion 16 percent of total reported in Q2 2013 to USD 2.8 billion -24 percent of total in Q2 2014, which consisted of USD1.4 billion Mobile Search, USD1.3 billion Mobile Display, and USD 54 million Mobile Other.
The Metrics used for measuring Internet Advertising remain focused on Performance Based Models.
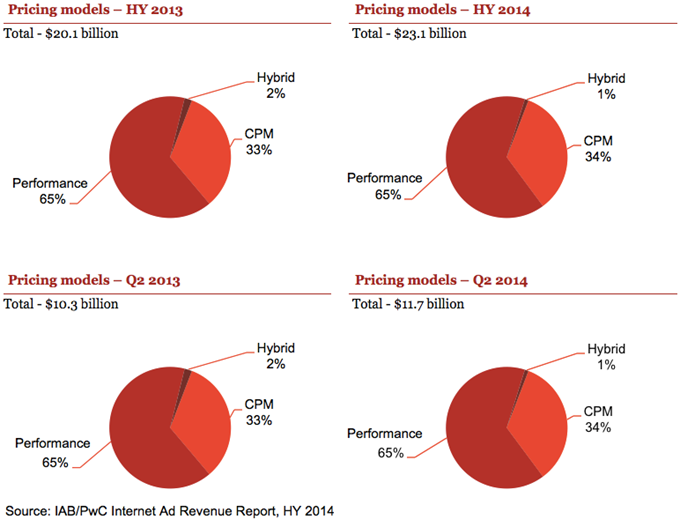
- Performance-based pricing remains the preferred model Performance-based pricing, the leading pricing model since 2006, remained at 65 percent of total revenue in 2014. Performance Based pricing takes into account cost per action.
- CPM/impression-based pricing gained in the first six months of 2014, up to 34 percent of revenues from 33 percent in Half-Year 2013. At 34 percent of total revenues, CPM is at its highest point since 2010.
- Hybrid pricing decreased to 1 percent of total revenues in Half-year 2014, down from the 2 percent reported in Half-Year 2013.
Ad revenues by industry category*
Most industry sectors remained consistent with last year for share of Internet advertising revenue.
- Retail drives advertising, as dollars shift to digital Retail advertisers continue to represent the largest category of internet ad spending, accounting for 21 percent of total revenues in Half-Year 2014, consistent with the 21 percent reported in Half-Year 2013.
- Financial Services advertisers accounted for 13 percent of revenues in Half-Year 2014, consistent with the 13 percent reported in Half-Year 2013. Automotive advertisers accounted for 12 percent of revenues in Half-Year 2014, consistent with the 12 percent reported in HY 2013.
- Telecom companies accounted for 9 percent of revenues in HY 2014, consistent with the 9 percent reported in Half-Year 2013. Leisure Travel (airfare, hotels, and resorts) accounted for 9 percent of revenues in HY 2014, up from the 8 percent reported in Half-Year 2013.
- Consumer Packaged Goods represented 7 percent in Half-Year 2014, consistent with the 7 percent reported in Half-Year 2013. Consumer Electronics and Computers represented 7 percent of revenues in HY 2014, up from the 6% reported in HY 2013.
- Pharmaceutical/Healthcare accounted for 5 percent in HY 2014, consistent with the 5 percent reported in HY 2013. Media accounted for 5 percent in HY 2014, consistent with the 5 percent reported in HY 2013. Entertainment accounted for 4 percent of HY 2014 revenues, consistent with2013.
*Definition of Industry Category
Retail Includes mail order/catalog, apparel, restaurants/fast food, home furnishings/textiles, toys, pet food/supplies, appliances, jewelry, drugstores, retail stores, and cosmetics stores.
Automotive Includes all automotive-related categories including sale/purchase of vehicles and parts and maintenance.
Entertainment Includes film, music, TV, box office, video games, and amusement & recreation.
Consumer packaged goods Includes packaged goods, food products, household products, and tobacco.
Leisure travel Includes travel, hotel, airlines, and resorts.
Consumer Electronics and Computers Includes hardware (computers, computer storage devices, and computer peripheral equipment), consumer electronics, prepackaged software (operating, utility, and applications programs), local area network systems and network systems integration, computer processing, and data preparation and data processing services.
Financial Services Includes commercial banks, credit agencies, personal credit institutions, consumer finance companies, loan companies, business credit institutions, and credit card agencies. Also includes companies engaged in the underwriting, purchase, sale, or brokerage of securities and other financial contracts.
Telecommunications Includes point-to-point communications services, including cellular phone services, paging services, wireless internet access, and wireless video services. Includes multichannel video providers on a subscription fee basis (e.g., cable television, wireless cable television, and direct broadcast satellite services).
Pharmaceutical & Healthcare Includes pharmaceutical products, facilities, services, researchers, and biological products. Also comprises establishments providing healthcare and social assistance for individuals as well as personal care, toiletries, and cosmetic products.
Media Includes establishments primarily engaged in radio and television broadcasting (network and station) including commercial, religious, educational, and other radio or television stations. Also includes establishments primarily engaged in publishing newspapers, periodicals, and books.
