Adobe reports mobile devices accounted for about 25 percent of sales and 45 percent of visits to retail websites from Nov. 1-Dec. 22. Adobe also reports that conversion rates have hovered between 3 percent and 3.5 percent since Thanksgiving, when it peaked at 5 percent. Out-of-stock rates are 10-15 percent higher than last year, indicating that retailers appear to be shifting more sales and inventory toward the start of the shopping season Adobe says.
The highest out-of-stock days were Green Monday (16 percent), Dec. 7 (15 percent) and Dec. 21 (14 percent), Adobe reports. Top-grossing products through Dec. 22 are Samsung 4K TV sets, Xbox, iPad mini, PlayStation 4, gift cards and iPad Air 2 Adobe says. Free Shipping Day accounted for USD 1.48 billion in Online Sales, and Cyber Monday on Nov. 30, The Monday after Thanksgiving was the largest U.S. online sales day in history with USD 3.07 billion in sales, followed by Black Friday, the day after Thanksgiving, at USD 2.74 billion spent online, according to the Adobe Digital Index, which bases its estimates on the sales of Adobe’s online retailer clients.
According to Internet Retailer, Data from e-commerce analytics provider Slice Intelligence shows that the online spending surge peaked on Monday Dec. 21, with revenues up 27 percent year-over-year. Slice bases its estimates by tracking receipts shoppers receive via email. According to Bloomberg, After getting online shoppers accustomed to two-day deliveries, the Web retailer is pushing to grab a bigger chunk of sales from brick-and-mortar stores. Amazon upped the ante this year by expanding its one-hour Prime Now delivery service to big cities. Total online shopping is on track to climb 11 percent in November and December to $95.5 billion, according to Forrester Research.
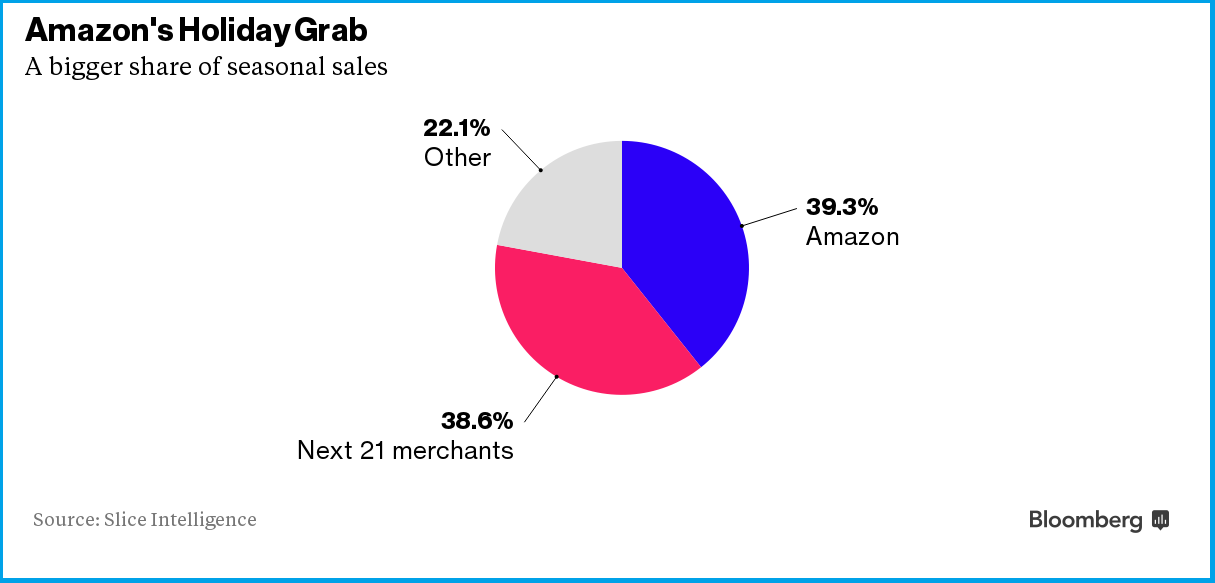
Amazon Inc. was the most dominant retailer on what Slice calls Manic Monday with 55 percent of what Slice calls “relative market share,” the percentage of a retailer’s sales versus those of direct competitors. However, apparel retailers experienced the most growth, Slice reports. Carters Inc. grew the most of any apparel retailer, seeing a year-over-year sales spike of 273 percent. Home goods e-retailer Wayfair LLC saw sales skyrocket by 158 percent, according to Slice. ChannelAdvisor clients selling on Amazon grew sales 18.1 percent from Dec. 15 through Dec. 21, down from the previous week’s 19.5 percent growth.
According to Marin Software report the key trends in Search and Mobile advertising are :
- Between Black Friday and Cyber Monday, smartphone clicks grew by 87 percent YOY almost equaling desktop clicks. This reflects a dramatic increase compared to 2014, when smartphone clicks accounted for only 28 percent of all clicks.
- Clicks grew across smartphones, tablets, and desktops, with the large increase in smartphone click share being attributed to growing smartphone adoption. The increase in tablet and desktop clicks YoY shows that people are using their smartphones in addition to desktop and tablet devices, not instead of them.
- Marin saw similar trends across spend, with the ad spend share for mobile growing by 66 percent YoY.
- Overall ad spend for mobile was up 101 percent with spend doubling on both Google and Bing YoY.
- Cyber Monday beat Black Friday in terms of clicks and ad spend for both 2014 and 2015 with cost per click (CPC) prices markedly higher than any other day over the weekend.
However according to comScore the key takeaways indicate that mobile and Desktop have different trends for site visits for retail with Mobile peaking on Black Friday and Desktop on Cyber Monday.

- Mobile traffic significantly outpaces desktop traffic every single day, including Cyber Monday.
- Mobile traffic peaks on Black Friday, while desktop traffic peaks on Cyber Monday.
- Cyber Monday is the peak day for overall multi-platform web traffic, but Black Friday is not far behind.
- Desktop traffic has a distinct weekly pattern with troughs occurring during the weekends, while mobile traffic is much more consistent across different days of the week.
Here are some updates that advertisers can use for priming the campaigns to engage online shoppers :
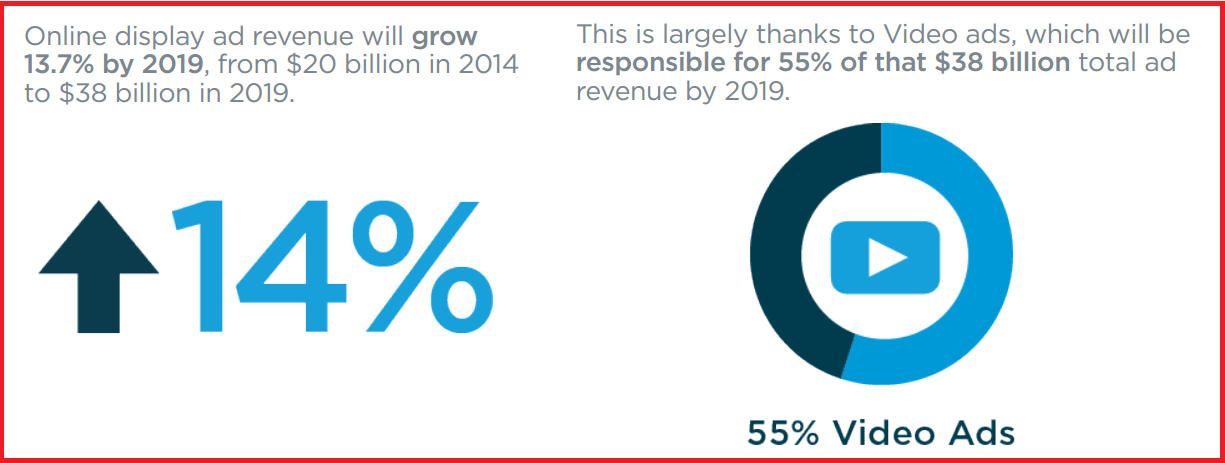
Mobile Video Key For Reaching Audiences
According to comScore the top featured video properties and ad sites for reaching online viewer are Google Sites, driven primarily by video viewing at YouTube.com, ranked as the top online video content property in November with 174.5 million unique viewers. Facebook came in second with 90.5 million viewers, followed by Yahoo Sites with 61.2 million, Vimeo with 56.5 million and VEVO with 44.2 million.


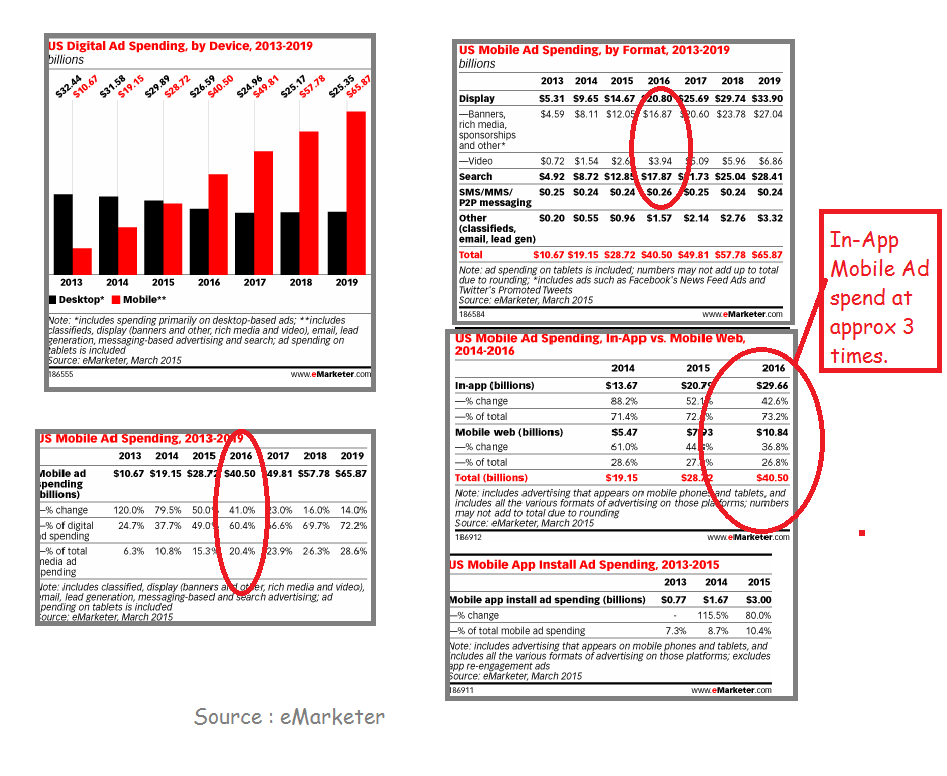
According to Salesforce.com based on eMarketer estimates, In 2016, mobile advertising will account for more than 50 percent of all digital spending for the first time. Mobile Video in Display will account for USD 3.94 Billion and InApp advertising on Mobile is likely to grow by USD 10 Billion. With the increasing amount of time spent on Social Network Apps and Entertainment apps Mobile video is likely to be the key advertising tactic. Video viewing according to research shared by Salesforce, increases with Income levels.

Shopping Campaigns
Adobe Digital Index predicts PLAs will constitute 30 percent of paid clicks in the fourth quarter of 2015. According to Channel Advisor, With their images and clearly marked prices, PLAs appeal to today’s visually driven online shoppers. And because the PLAs power Google Shopping, Google’s comparison shopping engine, PLAs attract consumers who know exactly what they’re looking for and are ready to buy.
Click-Share Optimization
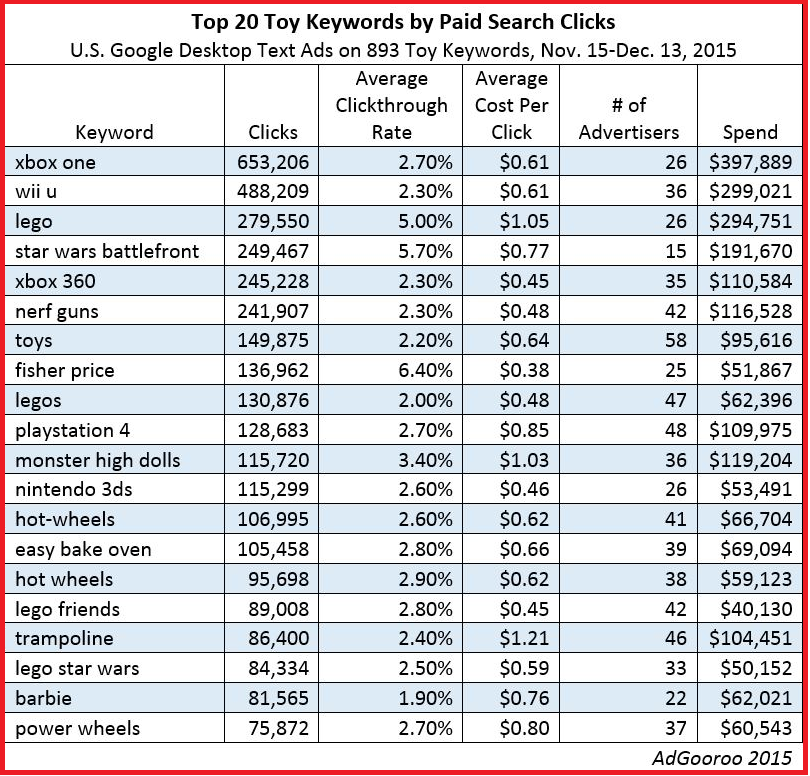
Advertisers optimized campaigns for Keywords to gain clickshare through the Holiday Season. For the Top 20 Toy keywords based on AdGooRoo’s analysis of spend for U.S. Google Desktop Text Ad activity, 7,060 advertisers spent USD 6 million sponsoring the 893 toy keywords via U.S. Google Desktop Text Ads from November 15 through December 13, while 996 advertisers spent USD 1.7 million sponsoring the keyword group via U.S. Google’s Product Listing Ads during the period. This implies that the spend on Text Ads is at about 3.5 times the spend on PLAs. This may vary for categories.

 Bing Ads Review Extensions and Action Link Extensions

Bing Ads has added extensions to Search advertising that let advertisers add Call-To-Action and feature reviews. According to Search Engine Watch, with Review Extensions advertisers can include third-party reviews in the search ads. For example, “It was one of the best trips ever,” is a consumer review likely to be incorporated in a search ad for a travel site. Review Extensions appear only for high-quality ads with a relevant review. It is a great opportunity to showcase customer satisfaction. Review Extensions can help content marketers in promoting content that is most suited for a product where customers begin their journey online. According to Vertical Measures, Research for Home and Garden category indicates, non-professional DIY segment substantiates behaviors of “webrooming” (shopping a product online before purchasing in-store) and “showrooming” (shopping in-store, then buying online). The higher the product price, the more likely these shoppers are to begin online. The study of DIYers indicates 72 percent of purchases of $1,000 or more involved online interfacing, with most of the activity consisting of webrooming. For product managers and retailers, creating transactional options and seeding informational content to drive purchase throughout the utilized channels is imperative.
Action Link Extensions, available to a few advertisers incorporate Call To Action in Search Ads that are easy to include in Ads.
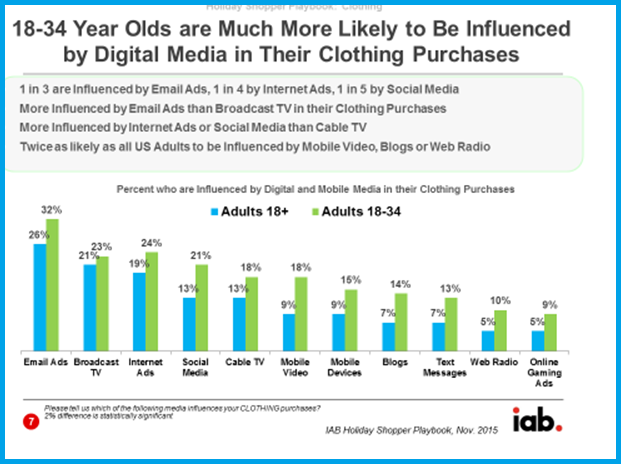
Digital Media Influence
Digital advertising influences purchases through the buyer journey, to arrive at the right attribution for different channels, advertisers need to understand the way audiences interact with different channels and how advertising influences purchase behavior.