Facebook introduced Newer Video Metrics and Publisher Tools for Facebook 360 Video. The new Publisher Tools for 360 videos make for a responsive viewing format, resulting in higher completion rates and increased watch time. Titled Guide and Heatmap the new Publisher Tools will create a guided experience for the viewer with a narrative that matches the viewer’s interest in the Video.
Publishers Tools For Guided Experience
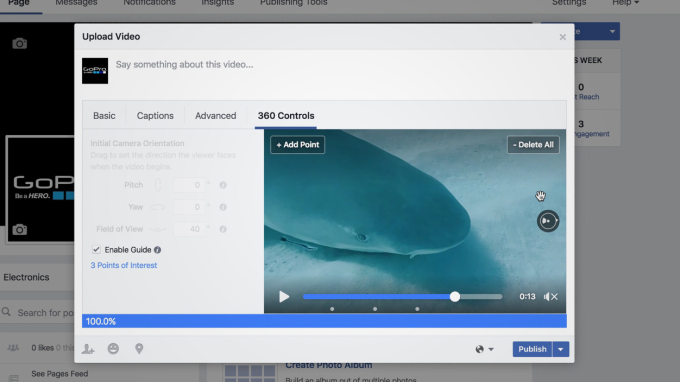
With Guide, publishers can edit the 360 video to create a guided experience. With Guide, users are guided through video for objects that are of most interest for the users. According to the Facebook Media Post, users can opt to view the guided experience with a narrative by using the onscreen indicator.The Guided experience brings out the narrative for a view that is chosen by the viewer. To add the point of interest and enabling guide Facebook Video provides 360 controls where publishers can define points of interest.
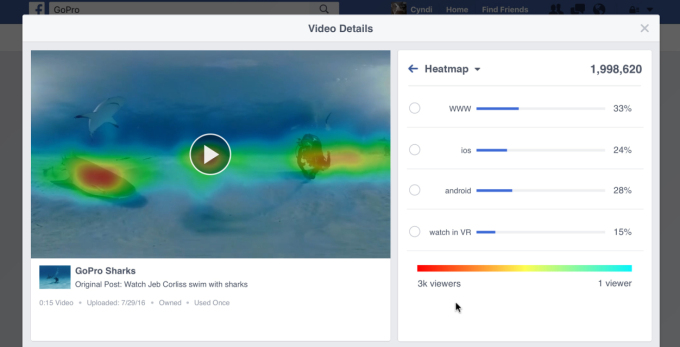
Heatmap is an insights tool for determining points of interest within a 30-degree span. With Heatmap publishers can determine the key points of interest for users making the Guide tool more effective.
Takeaway
Targeting different Audience Segments with a narrative that is of interest for the viewers can make for a more engaging experience increasing the Watch-time.
New Video Metrics
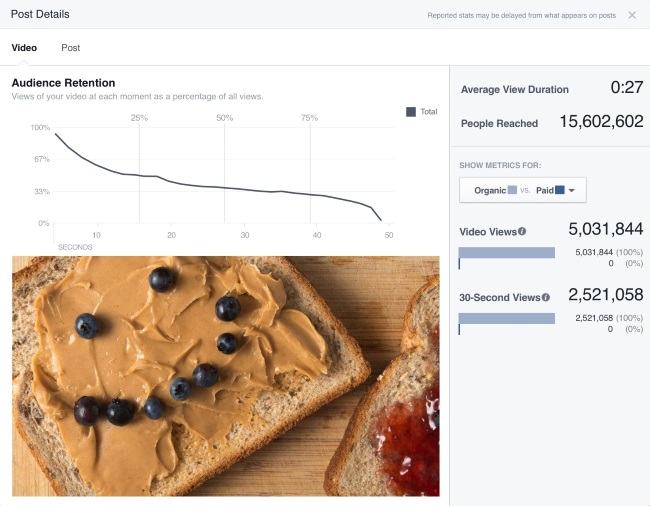
The new metrics for Video will give a complete snapshot analysis for each video with a round-up of Minutes viewed, Unique viewers and Audience reach. The video metrics are available for video posts including Facebook Live, 360 and Video uploads. With enhanced metrics, media brands, publishers, advertisers and Broadcast media can gain insights for their video content strategy. Audience and Engagement Card available for all video will give a breakdown of key targeting attributes including age, gender, and location.
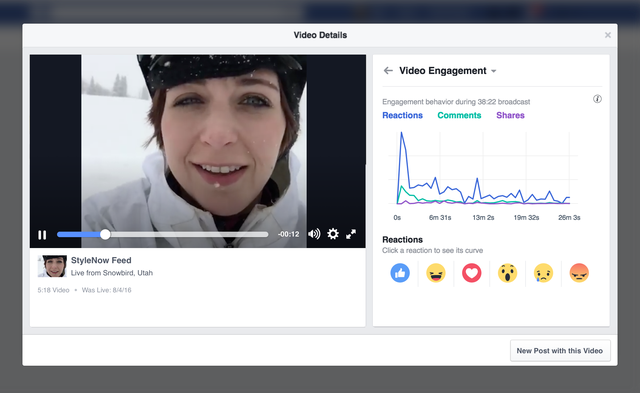
For Facebook Live Video publishers can gain an insight for the engagement graph to know the reaction and points of interest for Facebook Live Video.
Takeaway
Knowing how the audience reacts to different parts of Live Stream can help broadcast publishers determine the moments that stir the reactions from different audience segments. Focusing on the target’s reactions and actions can increase viewers watch time and retention rates.

Takeaway
With a Snapshot analysis, publishers can determine the reach and completion rates, to understand the performance of their content strategy. This can help publishers and Brand pages determine content genre that increases the video watch time and engagement rate with target audience.


According to Facebook Media blog post, nearly 48 percent of video watch time on Facebook comes from shares. With new metrics publishers can gain insights on Video watch time for shared videos that originate from shared videos and posts pages.

Takeaway
With insights from the metrics that guide the insights with target audiences data on location, gender, age for video content, users can know the content genre and video content that target audiences find engaging. The Audience Engagement graph and Audience Retention for different spots can help publishers determine the right content duration.
Facebook Live Video Goes Mainstream
Facebook Live is the preferred engagement tactic with nearly half of the Media pages as reported by Social Bakers. Facebook Live has recently added broadcasts for up to 4 hours with a video only mode that allows uninterrupted viewing without comments and reactions. With live video adoption rate Brands are increasing the share of live posts to increase reach with younger and engaged audiences.

Takeaway
Find out the point that is likely to grab your users attention. Plan your Live Stream content strategy for users to return to your page for the content that they are engaging with on social networks. As shares account for 48 percent of video watch time, creating user-friendly clips for your fans can increase the share rate.
