
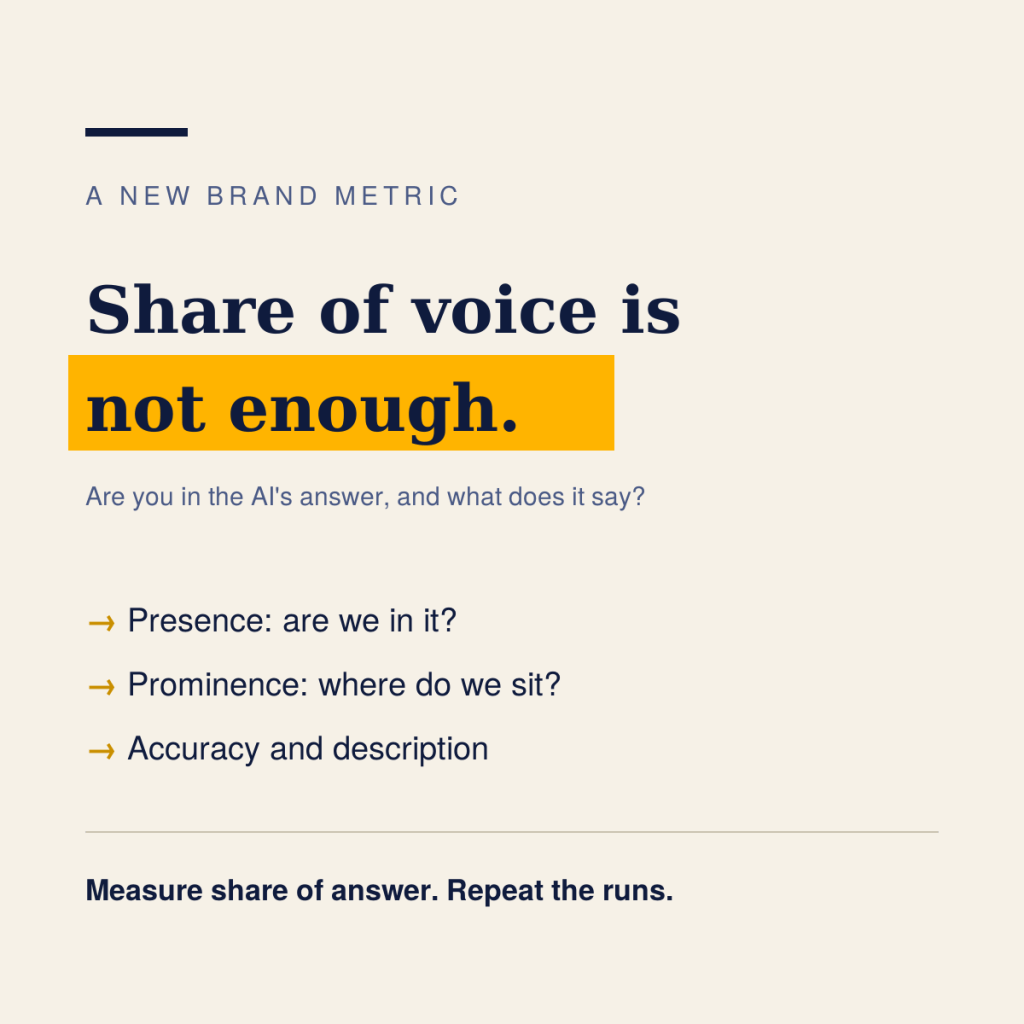
Marketers have spent years measuring how visible a brand is with share of voice, rankings and clicks. When an AI answers the customer’s question directly, those numbers miss the moment that matters: whether your brand is in the answer, and what the answer says about it.
I am calling the missing measure share of answer. It is my working label, not an industry standard, and no one has published a single agreed definition. This post sets out a way to define it, how much to trust any single reading, a scorecard you can start with, and where the metric breaks. The evidence is early, so I flag what is research, what is vendor opinion and what is my own proposal.
What share of answer is, and what it is not
This section is my proposal, not an established definition.
Share of answer is the proportion of AI-generated answers to a fixed set of customer questions in which your brand appears. For example, if you ask 20 questions five times each and your brand shows up in 30 of the 100 answers, your share of answer is 30%.
It differs from older measures in three ways:
- It is about answers, not pages. Share of voice counts mentions across media. Rankings count positions in a list of links. Neither tells you what a person who asked an AI actually saw.
- It needs a fixed question set. An answer has no “search volume” to weight it, so you choose the questions, based on what your customers really ask before buying.
- It is more than a count. Being in the answer is the first test. Being described correctly, and in a way that helps you, is the second. I handle this with a scorecard later.
It is also not a ranking position or a guarantee of traffic. A brand can be in the answer and get no visit, and the metric is meant to capture exactly that gap.
One reading is never enough
AI answers change from one run to the next. SparkToro, with Gumshoe.ai, had 600 volunteers run 12 identical prompts through ChatGPT, Claude and Google’s AI about 2,961 times in total. Each response was turned into an ordered list of brands or products and compared. The responses almost never matched. For ChatGPT and Google’s AI, the chance of getting the same list twice in 100 runs was under 1 in 100, and an identical order appeared about once in 1,000 runs (MediaPost).
Three caveats from the same report. The article gives no fieldwork dates and does not share the full method. Results were steadier in smaller markets, such as regional services and niche B2B tools. And the study did not look at how brands were described, only whether and where they appeared.
The lesson is not that tracking is pointless. The same coverage notes the researchers concluded it is not useless. The lesson is that a single screenshot of one answer is an anecdote. A defensible metric averages many runs over a fixed question set, and reports a range, not a point.
How to measure it
This is a working method. The numbers in it are starting points, not proven thresholds. One AI-visibility vendor suggests 100 to 200 prompts, 3 to 5 repeats per prompt and weekly runs, but gives no data behind those figures (LLM Pulse). Adjust to what you can sustain.
- Build the question set from real customers. Draw on sales calls, service tickets, search queries and community threads. Cover three kinds: category questions (“which lender should I choose?”), comparison questions (“X versus Y”) and situation questions (“what suits a first-time buyer?”). Start with 20 to 30 you can run by hand, then grow.
- Fix the list of competitors and the AI tools. Track the same rivals and the same tools each time, such as ChatGPT, Gemini, Perplexity and Google’s AI answers, and report each tool separately.
- Run each question several times. Given how much answers vary, repeat each question at least three times and use the average. Use a fresh session each time so earlier chats do not colour the result.
- Record the same things every run. Whether your brand appears, where in the answer, what is said about it, which sources are cited, and which competitors appear.
- Repeat on a schedule. Monthly is realistic for a team doing it by hand. Hold the question set steady for at least a quarter so trends mean something, and add new questions as a separate list.
- Keep the raw answers. Store the text, tool and date of every run so you can audit a score later and show a leader what the AI actually said.
The four-part scorecard
Share of answer on its own can flatter you. A brand that is mentioned often but described wrongly is losing, not winning. I suggest four scores, all my own proposal, each worked out per tool and per question group.
| Score | Question it answers | How to calculate it | Read it with care because |
|---|---|---|---|
| Presence | Are we in the answer? | Answers that mention us ÷ answers sampled | Averages hide big differences between question groups |
| Prominence | Are we near the top or buried? | Share of answers where we are named first, or in the first two names | Order varies a lot between runs, so use averages over many runs |
| Accuracy | Is what it says about us right? | Answers with no factual error about us ÷ answers that mention us | Needs a person to check against your fact sheet |
| Description | Is the framing helpful? | Answers that describe us the way we want to be seen ÷ answers that mention us | Subjective, so use a written rubric and two reviewers |
Read them together. High presence with low accuracy is a repair job on your facts. Low presence with high accuracy is a visibility problem. Good prominence with a weak description points to a gap in your content or in what others say about you.
How to report it and what to do with it
Report it the way you would report any early-stage metric: as a trend with a range, and with the questions behind it.
- Show a range, not a single number. “Between 25% and 35% across three runs” is more honest than “30%”, and it protects you when next month’s reading dips for no reason.
- Split by question group. Category questions often matter most for new customers. Comparison questions show who you lose to. Keep them separate.
- Put it beside the outcome metrics. Place share of answer next to branded search, leads and applications for the same product, so leadership sees whether visibility is moving results. I would not claim causation on one quarter of data.
- Turn each gap into an owner and an action. A wrong fact goes to the product team. A missing answer goes to content. A weak third-party description goes to PR and reputation work.
- Set targets cautiously. Start with “improve our own baseline” and a floor for accuracy, not a share target borrowed from a vendor benchmark.
Pitfalls and limits
- Volatility. As the SparkToro work suggests, order and list contents change run to run. Use averages and ranges, and distrust any score shown to one decimal place.
- Your question set decides the result. Choose questions where you already look good and the metric flatters you. Write the list down before the first run and share it with someone who will challenge it.
- Personalisation and location. What a customer sees may differ from what a fresh session returns. Treat your numbers as a consistent yardstick, not a picture of what every customer saw.
- Tools change. A model update can move your score overnight. Note the date and tool version of each run so you can tell a real change from a platform one.
- No access to the platforms’ systems. Google says no third-party tool has access to its internal ranking or AI systems (Google Search Central). Any paid tracker is sampling outputs like you do, so ask a vendor how many runs back each number.
- Presence is not influence. Being in the answer does not show that it changed a decision. Pair it with business outcomes.
Considerations for BFSI and fintech
This section is my own analysis.
In financial services the accuracy score matters more than presence. An answer that names you with an old rate, the wrong eligibility rule or a product you no longer sell is worse than not being named at all, because the customer arrives with a wrong expectation.
- Weight accuracy highest. Treat any factual error about rates, fees, eligibility or risk as a defect to fix and log, not a data point to average away.
- Keep a single fact sheet to check against. Reviewers need an approved source of truth, with a date, to score accuracy fairly.
- Include the questions people ask when they are worried. Complaints, fees, safety and “is it genuine?” questions show how an AI describes your reputation, and they are where trust is won or lost.
- Involve compliance in the question set. Decide up front how you will handle an answer that makes a claim about returns or advice, and who may report it to a platform.
- Do not use customer personal data in prompts. Test with generic situations, not real customers’ details.
A 30-day starter plan
- Week 1: Pick one product line. Write 20 customer questions across category, comparison and situation types, and agree the competitor list and the AI tools.
- Week 1: Write the one-page fact sheet that accuracy will be scored against, and agree a two-line rubric for “description”.
- Week 2: Run every question three times in each tool, in fresh sessions. Save the full text, tool and date.
- Week 3: Score presence, prominence, accuracy and description. Have two people score a sample so you can check they agree.
- Week 3: List the gaps and give each an owner: facts, content, reputation or technical.
- Week 4: Present the baseline as ranges with three actions. Agree the monthly rerun date and keep the question set locked for the quarter.
The takeaway
If customers increasingly ask an AI before they ask a search engine, then whether you are in the answer, and what it says, is a brand metric. It is noisy, it is new and nobody has standardised it. That is a reason to measure it carefully, with fixed questions, repeated runs and honest ranges, not a reason to wait. The brands that start a baseline now will know, a year from now, whether their work moved the answer.
Sources
- MediaPost: AI brand recommendations, chaotic and inconsistent: coverage of the SparkToro and Gumshoe.ai study; the article gives no fieldwork dates.
- LLM Pulse: how to measure AI share of voice: vendor blog; its thresholds are heuristics with no cited data.
- Google Search Central: optimising for generative AI search: Google’s own guidance, including its statement on third-party tools.

