
For years, the fashionable measurement question in marketing was which click led to which sale. Dashboards promised to trace every conversion back to an ad, and budgets followed the numbers.
Now a method that has been around for decades is back on the CMO’s agenda: marketing mix modelling, or MMM. It does not track individual people. It looks at the whole picture, including spend by channel, prices, promotions, seasonality and sales over time, and estimates what each part contributed.
The reasons for the comeback are practical. Tracking individuals has become harder, platforms mark their own homework, and finance teams are asking tougher questions about where the money goes. This article explains what MMM is, why it is returning, how it compares with other methods and how to start, with a focus on financial services.
What marketing mix modelling is
MMM is a statistical method that estimates how drivers such as price, promotion, distribution and media affect outcomes like sales or new customers. It separates the incremental effect of each from the baseline trend and the noise, and it covers non-media factors as well as paid media (Measured).
It works on aggregate data, such as weekly spend by channel and weekly sales, not on individual people. That is why it needs no cookies or personal identifiers.
In plain terms, it asks: if we had spent more on one channel and less on another last quarter, what would probably have happened to sales? A typical model uses regression with two ideas built in: adstock, meaning the effect of advertising carries over time, and saturation, meaning each extra rupee of spend does a little less than the last (Digital Applied).
It typically produces three things:
- Contribution by channel: how much of the result each channel and non-media factor drove.
- Response curves: where extra spend stops paying back.
- Scenarios and budget recommendations: what might happen if you move money around. Google’s open-source tool, Meridian, produces budget optimisation recommendations and scenario analyses (Google).
One caution belongs at the start. MMM finds relationships in historical data. It is not inherently causal unless it is calibrated with experiments (Measured).
Why it is back
Four things have pushed MMM back up the agenda.
- Tracking individuals got harder. Privacy rules and the loss of tracking signals have weakened person-level measurement. Google says Meridian needs no individual identifiers or cookies, which it calls privacy-safe (Google).
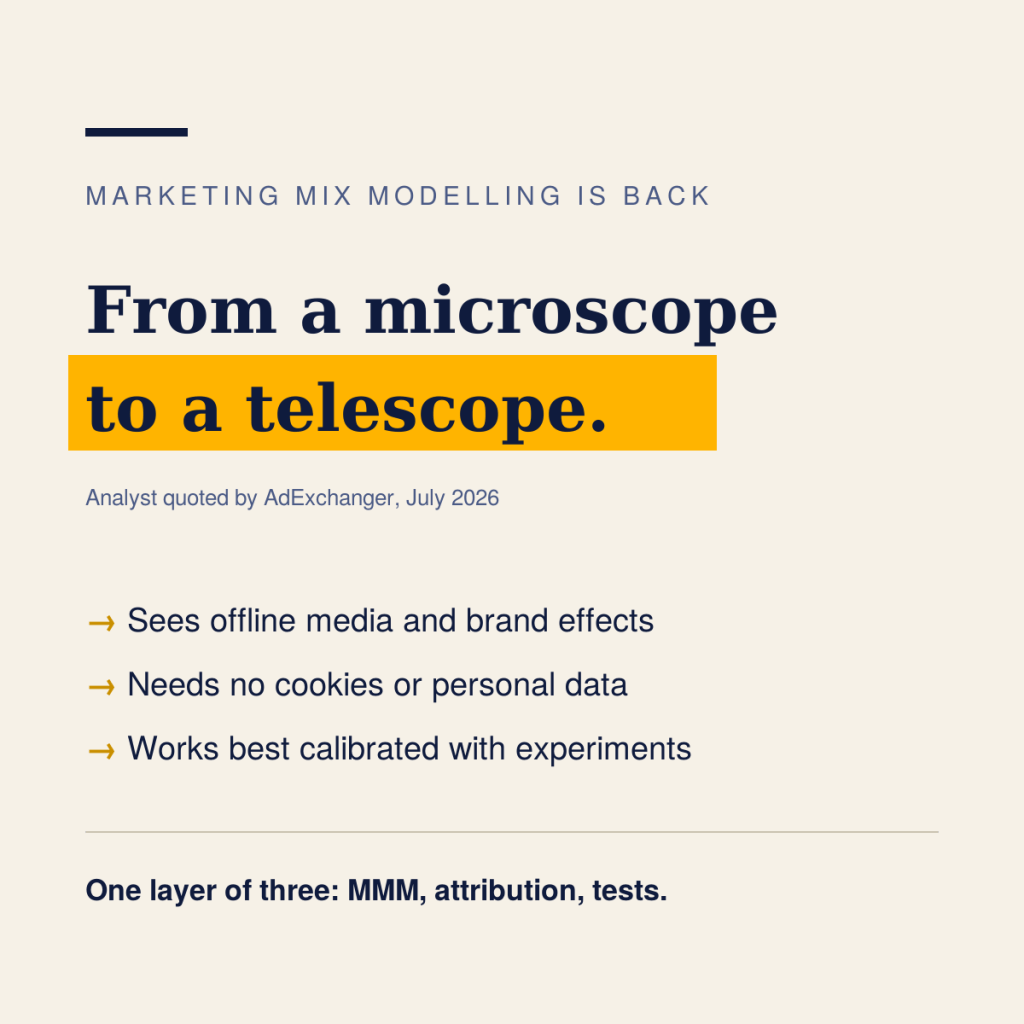
- Platform reporting got more opaque. As buying becomes automated, marketers see less about where ads run. One travel-brand analyst quoted by AdExchanger values MMM for moving “from a microscope to a telescope”, crediting channels such as TV, radio, out-of-home and search with more control than the placement reporting in automated campaign types gives (AdExchanger, July 2026).
- Offline and brand effects need credit. MMM covers all channels, including offline and brand. Attribution sees only the trackable slice, so it tends to over-credit digital channels (Digital Applied).
- Free, open tools lowered the barrier. Meta’s Robyn arrived in 2020, and Google describes Meridian as launched at the start of 2025. Both let teams build a model without buying a platform. Meridian can also use the results of incrementality experiments to calibrate its estimates (Google).
The appetite shows up in surveys, too. As reported by Digital Applied, eMarketer’s 2026 data found 27.6% of US marketers rating MMM the most reliable method, against 19.4% for multi-touch attribution. That is a preference, not proof of accuracy.
The comeback comes with caveats, covered under pitfalls below.
How MMM compares with attribution and experiments
MMM is not a replacement for everything else. Each method answers a different question, and the strongest set-ups use all three.
| Marketing mix modelling | Multi-touch attribution | Incrementality tests | |
|---|---|---|---|
| What it does | Regresses aggregate spend and other drivers against sales | Tracks individuals across touchpoints and splits the credit | Compares exposed regions or audiences with a control group |
| Strengths | Covers every channel, including offline and brand. Needs no personal data. Supports budget allocation | Fast and granular, and useful for weekly digital tweaks | Gives causal evidence and settles disputes between the other two |
| Weaknesses | Slow. Can give confident but wrong answers if inputs are incomplete or history is short | Sees only the trackable slice. Identity coverage has fallen | Hard to run for national media. Covers only the channels tested |
| Data needed | Roughly two years or more of clean weekly spend and sales data | User-level journey data with identity resolution | A designed split of regions or audiences |
| Speed | Quarterly or rolling | Near real time to weekly | A test period, then analysis |
| Best used when | Spend includes offline media, or sales cycles run beyond about 30 days | Sales cycles are short and conversion volumes are high | The other methods disagree, or you need to validate a model |
The table draws on Digital Applied, with the data requirement also reflecting Google’s guidance that Meridian needs at least two years of history.
The layered approach it recommends is simple. Use MMM to set quarterly budget envelopes, attribution for weekly digital tactics inside them, and experiments to validate the model and resolve conflicts.
What it means in financial services
This section is my analysis, not a sourced finding, and the examples are illustrative. Financial services has several features that make MMM both useful and tricky.
- Long, lumpy journeys. A loan, an insurance policy or an investment is rarely bought on first click. Long consideration cycles are exactly where click-based attribution struggles and MMM is said to fit best.
- Offline and relationship influence. Branches, relationship managers, call centres and partners shape outcomes. MMM can include them as drivers, where click tracking cannot.
- Brand and trust effects. Brand spend builds the trust that makes performance campaigns work later. MMM can estimate that lagged effect, which is hard to see in last-click reports.
- Strong seasonality. Tax-saving season, festival offers, salary cycles and rate changes move demand regardless of marketing. A good model separates these from media effects.
- Thin data for niche products. Low-volume products, such as a specialised bond offering, may not have enough observations for a stable model. Model at a higher level, such as a product family, or rely more on experiments.
- Choose the outcome carefully. Model disbursed loans, activated cards or first investments, not leads. Otherwise the model repeats the cheap-lead trap.
Example: A lender models weekly disbursals against spend on search, social, TV, outdoor and branch promotions, with variables for rate changes and festival weeks. The model suggests that search is near saturation while a regional TV campaign is under-funded. The lender then tests that finding with a geo experiment before moving a large budget.
How to start
You do not need a large programme. You need a clear question, decent data and the discipline to test what the model tells you. The examples are illustrative.
- Define the outcome that matters. Pick the result the business cares about, not the easiest one to count.
- Example: Activated customers or disbursed loans, not leads or clicks.
- Gather at least two years of weekly data. Include spend by channel, prices and rates, promotions, seasonality and relevant external events. Google says Meridian needs at least two years of history.
- Example: Weekly spend for search, social, TV, outdoor and branch campaigns, alongside weekly disbursals, rate changes and festival weeks.
- Capture all the spend. Leaving channels out can distort the results for the ones you include.
- Example: Add sponsorships, partner marketing and agency-managed spend, not just the platform dashboards.
- Choose your route and your people. Open-source tools are free to download, but Google notes that most teams need a data scientist or a partner to get the most from Meridian.
- Example: A small in-house analyst paired with an independent consultant for the first build and review.
- Calibrate with experiments. Run a geo or holdout test on one or two channels and use the results to check and tune the model.
- Example: Pause one channel in a few matched regions for six weeks and compare results with the model’s prediction.
- Move a slice of the budget first. Act on findings gradually and measure what happens.
- Example: Shift around 10% of the budget the model flags as saturated into the channel it flags as under-funded, then compare outcomes.
- Refresh regularly. Models go stale in volatile markets (Measured).
- Example: Re-run the model every quarter and after any major pricing or product change.
- Set up governance. Decide who owns the model, document its assumptions and have it reviewed independently.
- Example: A one-page assumptions log signed off by marketing, finance and analytics.
Pitfalls to avoid
- Treating the output as truth. MMM is correlational unless calibrated with experiments. Treat its answers as strong hypotheses to test.
- Accepting default settings. AdExchanger quotes Mutinex’s CEO warning that many advertisers use Meridian’s off-the-shelf settings, when the model should be customised for each business (AdExchanger).
- Treating free as cheap. The software is free, but the data work, the people and the review are not. The same article likens it to a puppy, not a free beer.
- Ignoring conflicts of interest. A platform-built model can be deeply tied to that platform’s ecosystem. Open code makes a method inspectable, but it does not make the model independent. Ask for independent review.
- Betting on one tool. AdExchanger reports, citing unnamed sources, that Meta is winding down Robyn. Whatever the outcome, keep your data and assumptions portable so you can switch tools.
- Over-fitting a thin history. With short or messy data, a model can fit the past beautifully and predict the future badly (Measured).
- Believing big vendor promises. One vendor guide claims 10 to 30% efficiency gains and cites no source for the figure (Measured, a vendor). Ask for independent evidence.
The bottom line
Marketing mix modelling is back because the click-based picture became less complete, not because it is magic. It sees what clicks cannot, including offline media, brand effects and the slow build of trust, and it works without tracking individuals.
Use it as one layer of three. Let MMM guide the big budget decisions, attribution guide the weekly tactics, and experiments keep both honest. Choose outcomes the business cares about, calibrate the model, review it independently and refresh it regularly.
A question for you: if you knew the true contribution of each channel to your last quarter’s results, which budget would you move first, and how sure are you of that answer today?
Sources
- Meridian: The future of marketing mix modelling is now, Think with Google (July 2025)
- Google’s Meridian and Meta’s Robyn: A gift to measurement or Trojan horses?, AdExchanger (James Hercher, 14 July 2026, updated 22 July 2026)
- Marketing Mix Modeling: A complete guide for strategic marketers, Measured (a vendor of MMM and incrementality products, published 24 June 2026)
- Marketing Mix Modeling 2026: MMM vs attribution playbook, Digital Applied. The eMarketer survey figure is quoted as reported here.

